
HashiCorp Consul Service Mesh on Kubernetes Series - Part 2 - Observability
Modern service meshes require robust observability to ensure seamless operations, proactive troubleshooting, and performance optimization. In this section, we explore the observability features of HashiCorp Consul Service Mesh, including visualizing the service mesh, querying metrics, distributed tracing, and logging and auditing.
Visualizing the Service Mesh
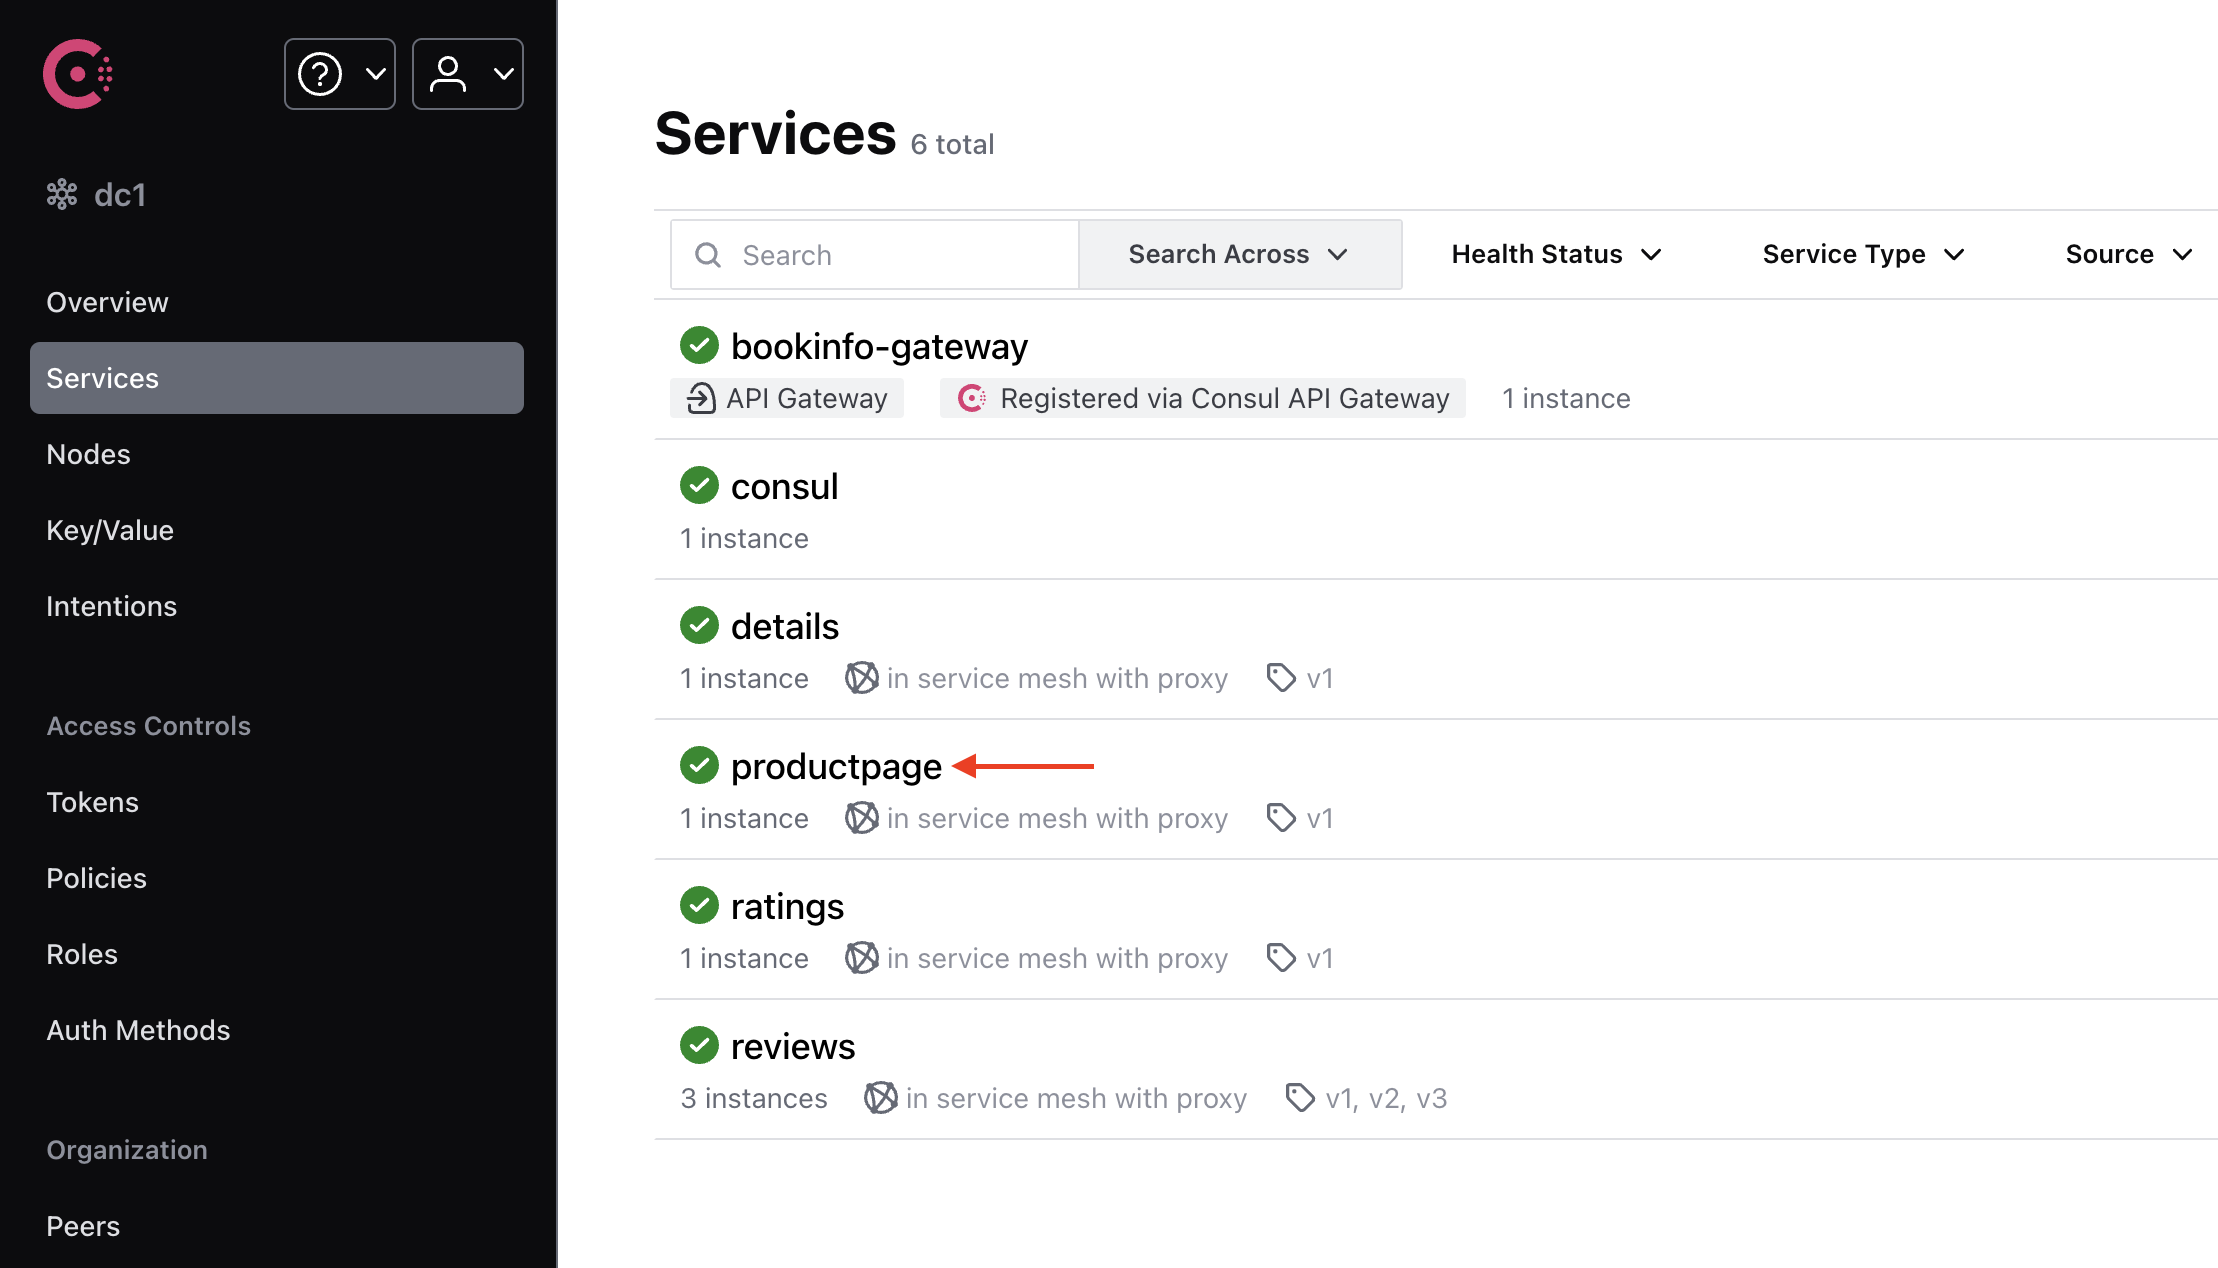
The Consul UI is used for visualizing the service mesh and its topology.
Use the watch command to send requests to the application continually. Make sure HTTP status code 200 is returned in the output.
GATEWAY_URL=$(kubectl get svc -n bookinfo bookinfo-gateway -o jsonpath='{.metadata.annotations.external-dns\.alpha\.kubernetes\.io\/hostname}')
watch -n 1 "curl -H \"x-client-trace-id: 1\" -k -o /dev/null -s -w %{http_code} $GATEWAY_URL/productpage"
Open the Consul UI and login using the bootstrap token. You can get the token using the following command:
kubectl get secret -n consul consul-bootstrap-acl-token -o jsonpath='{.data.token}' | base64 -d
Select the productpage service.
In the Topology tab, you can see the service topology and traffic flow. In this example, you can see that the inbound traffic is routed to productpage directly from the bookinfo-gateway, and the outgoing traffic is routed from productpage to details and reviews.
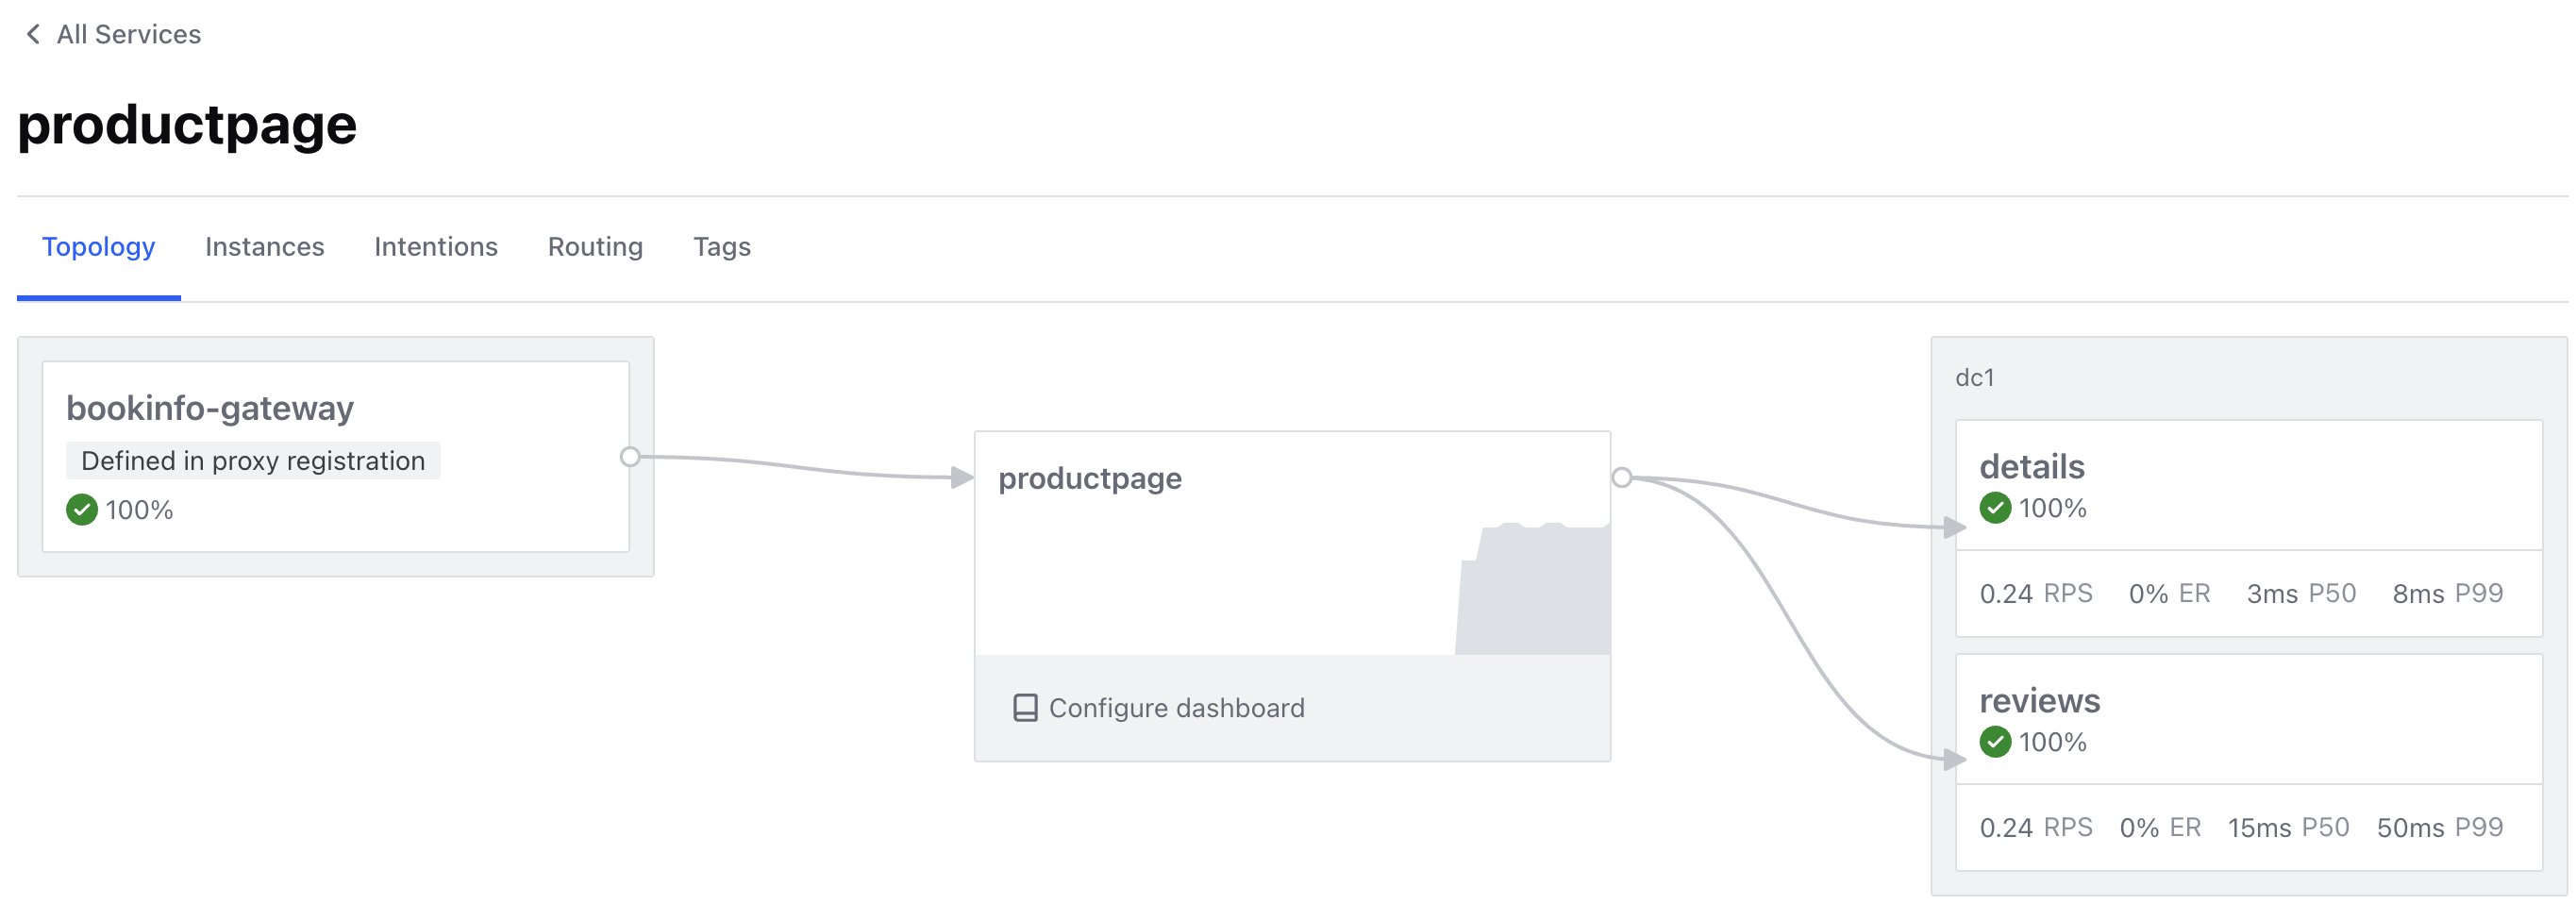
Note: unlike Istio, Consul doesn’t support the Kiali integration and the Consul UI doesn’t show the full mesh topology. You can view service-level topology. Also, unlike Kiali, the topology view provided by Consul is based on the configured intentions, not on actual traffic.
Querying Metrics from Prometheus
Open Prometheus in a web browser (e.g. https://it-fmsm-con-01-prometheus.it-cna.com).
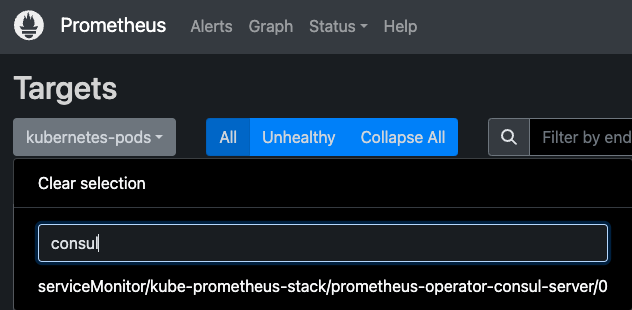
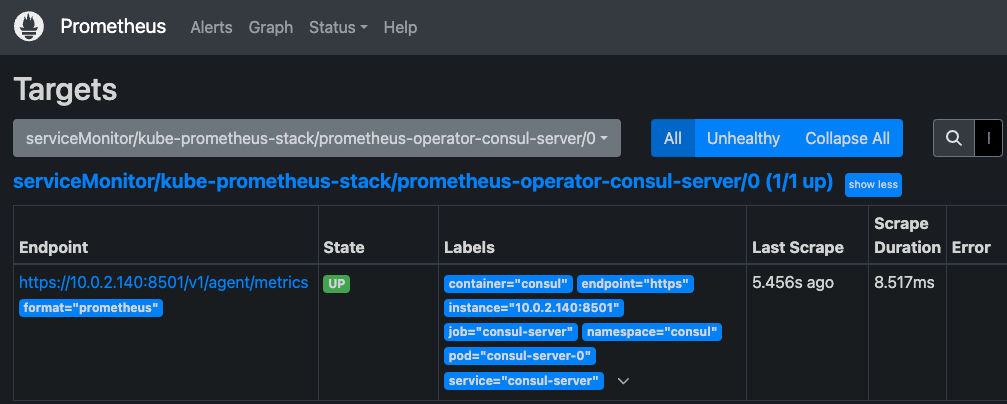
From the top menu, go to Status > Targets and filter by consul in the text box. Ensure the prometheus-operator-consul-server target is listed and healthy. For example:
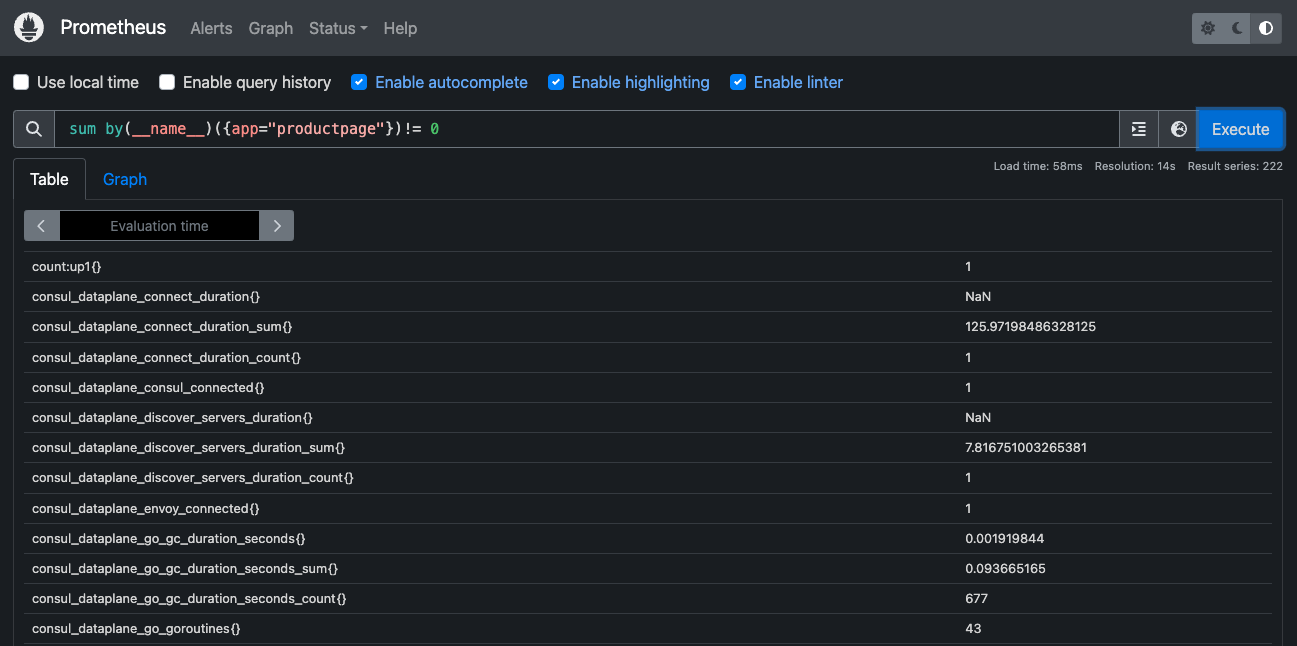
Go to the Graph tab and execute a Prometheus query. In the Expression input box at the top of the web page, enter sum by(__name__)({app="productpage"})!= 0, then click the Execute button.
You should see your metric data.
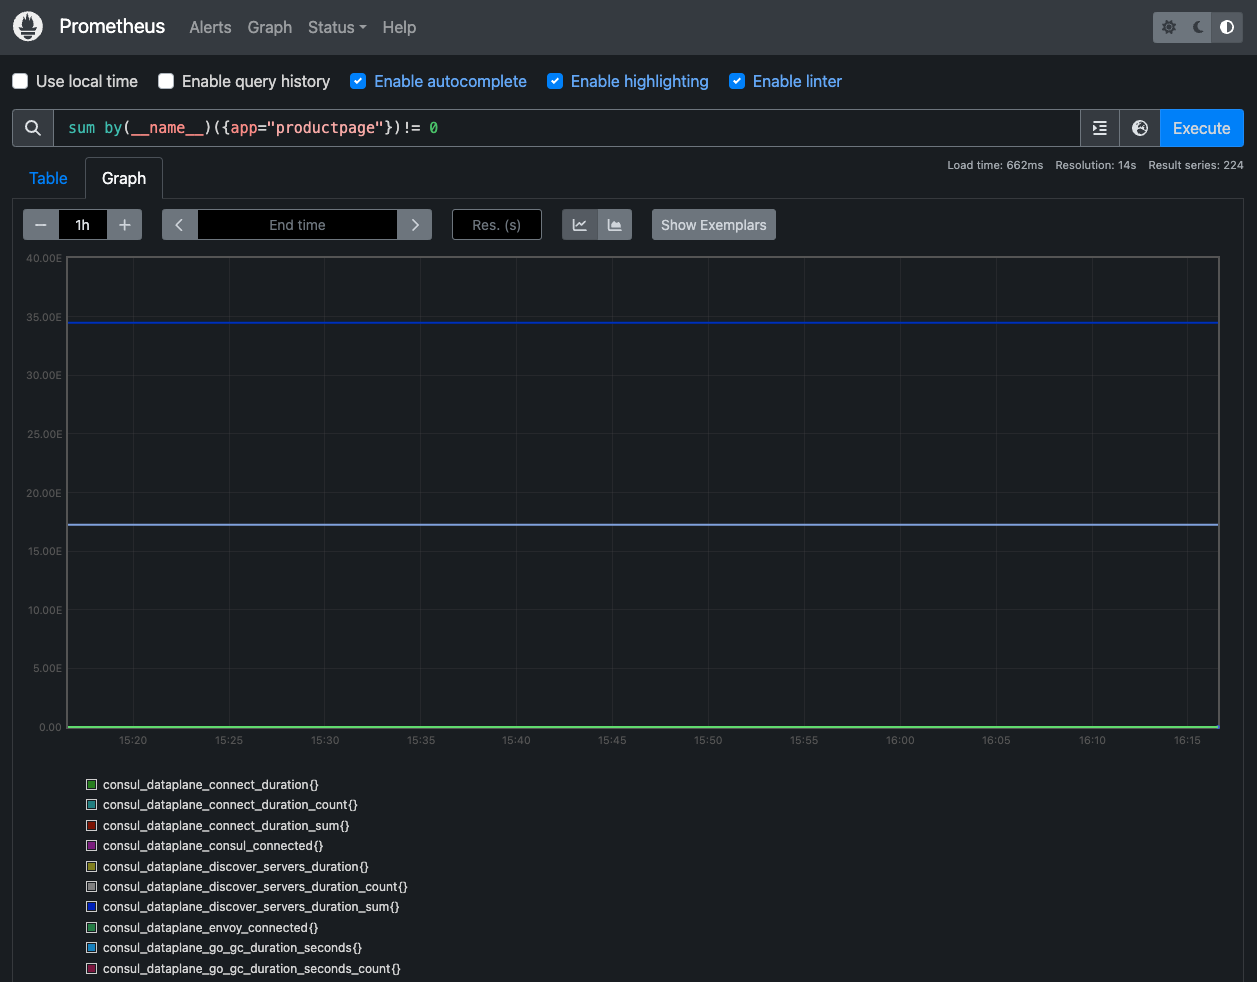
You can also see the query results graphically by selecting the Graph tab underneath the Execute button.
Visualizing Metrics with Grafana
Open Grafana in a web browser (e.g., https://it-fmsm-con-01-grafana.it-cna.com).
From the menu, go to Dashboards, then expand the Service Mesh folder, where you should see several Consul dashboards.
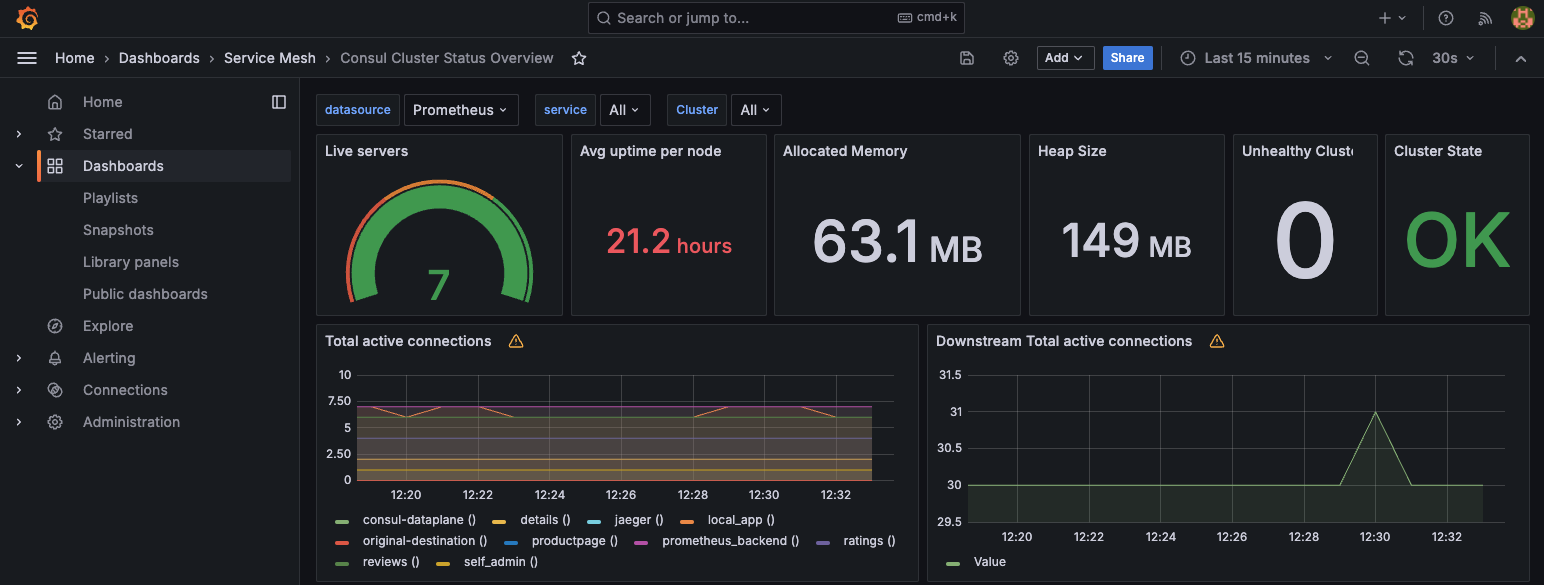
Click the Consul Cluster Status Overview dashboard to view it.
The dashboard will look similar to the following.
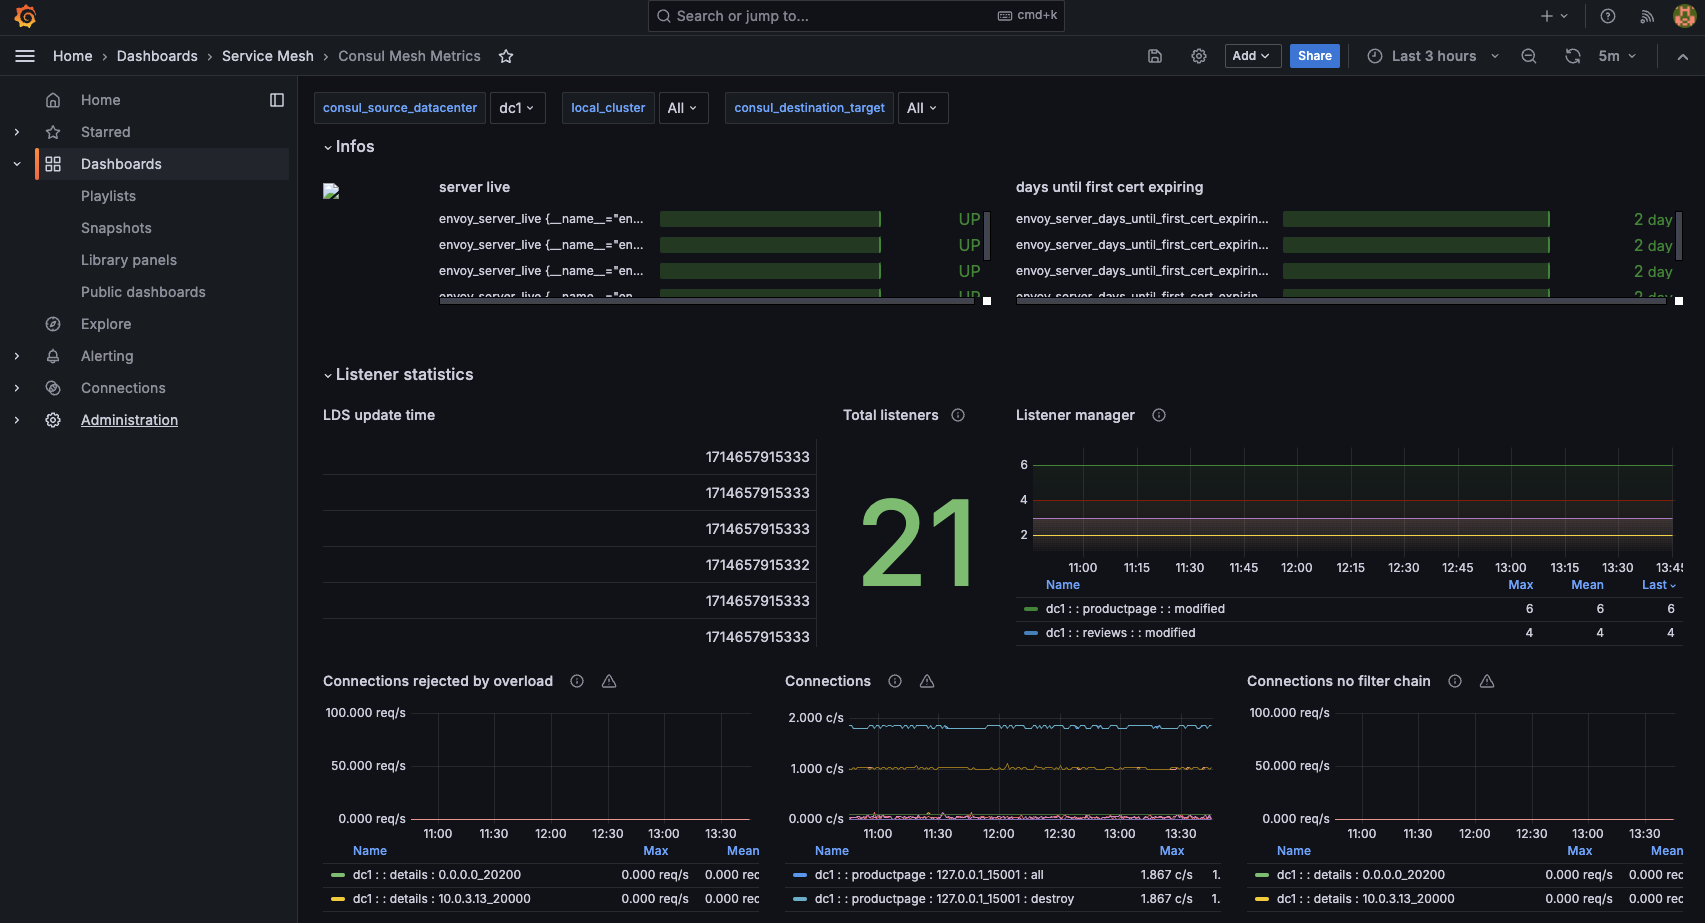
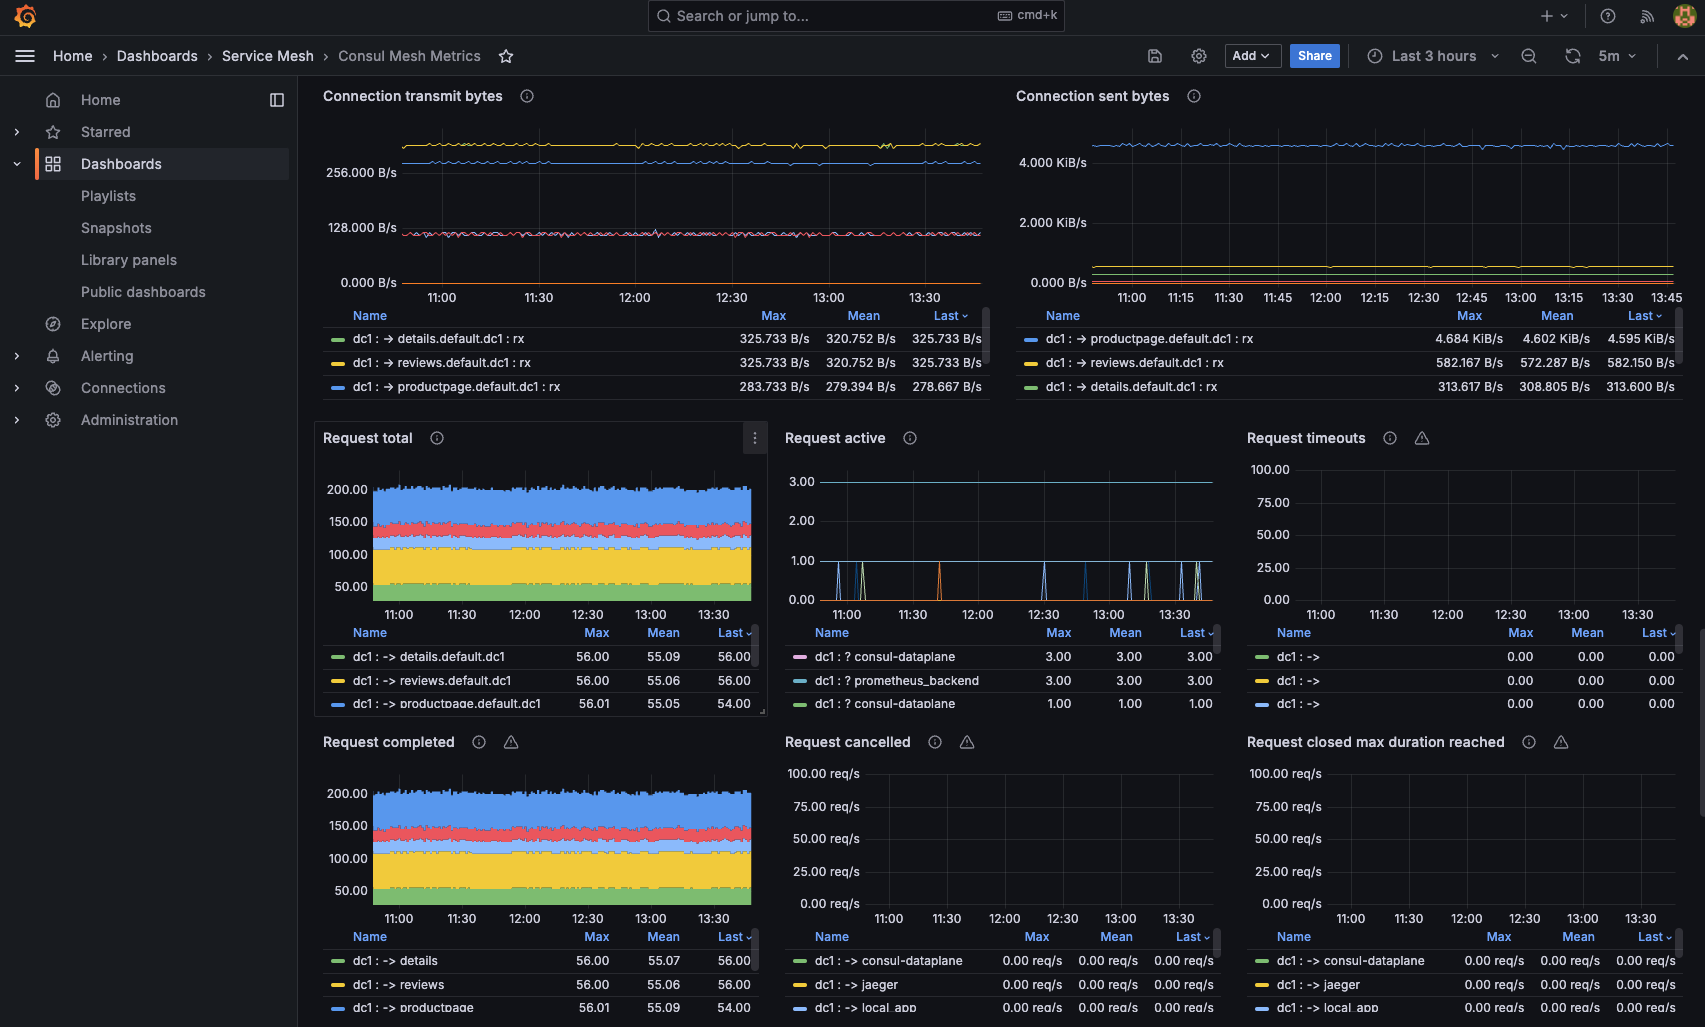
The Consul Mesh Metrics dashboard can provide additional insights on services in the mesh, their connections, listeners, and more.
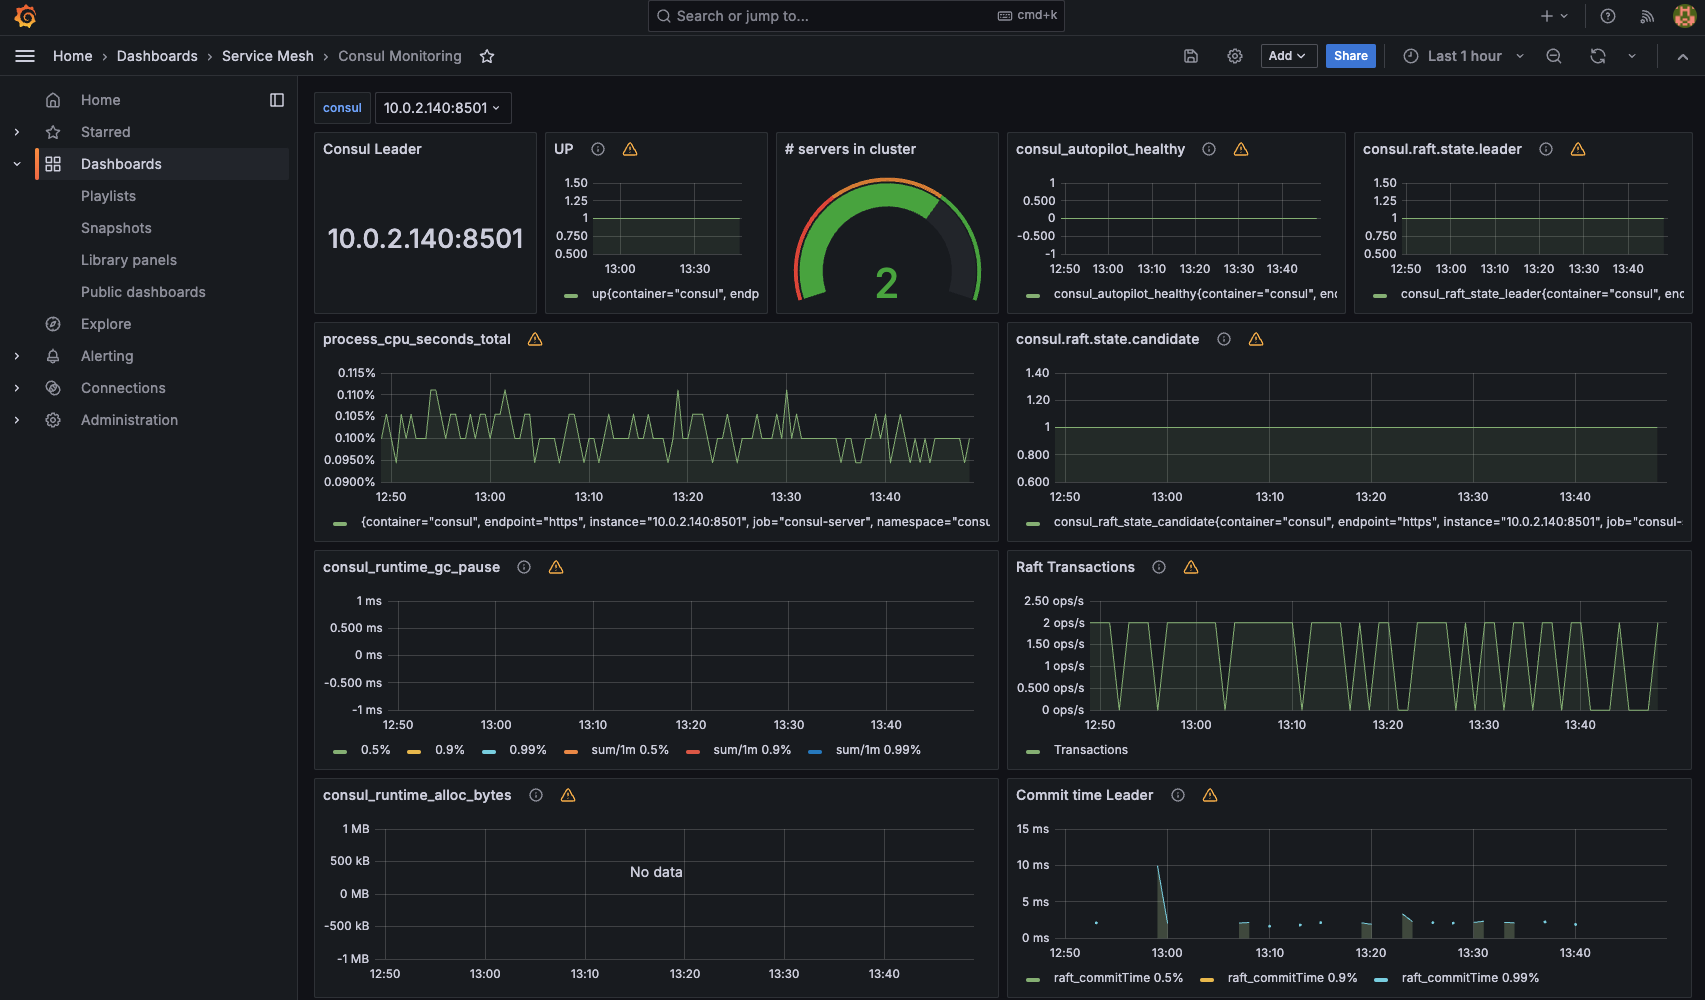
The Consul Monitoring dashboard can provide server/control plane data.
You can explore additional dashboards in the Consul folder.
Distributed Tracing
In this section, we will use Jaeger to view how our Bookinfo application participates in tracing, have a look at how it works, what is required for it, and what you can benefit from it.
Send some traffic to the mesh.
NUM_REQUESTS=300
GATEWAY_URL=$(kubectl get svc -n bookinfo bookinfo-gateway -o jsonpath='{.metadata.annotations.external-dns\.alpha\.kubernetes\.io\/hostname}')
for i in $(seq 1 "$NUM_REQUESTS"); do curl -H "x-client-trace-id: 1" -k -o /dev/null -s -w %{http_code} "$GATEWAY_URL/productpage" && echo " received for request $i "; done
Important note: if you are generating the traffic by accessing the application from your web browser, you must pass the
x-client-trace-id: 1header from your browser. For example, on Google Chrome, you can do so using the ModHeader extension. For more information, refer to this section on the official documentation and this GitHub issue. The reason you have to pass this header is that Envoy doesn’t initiate this action by default in Consul, as opposed to Istio.
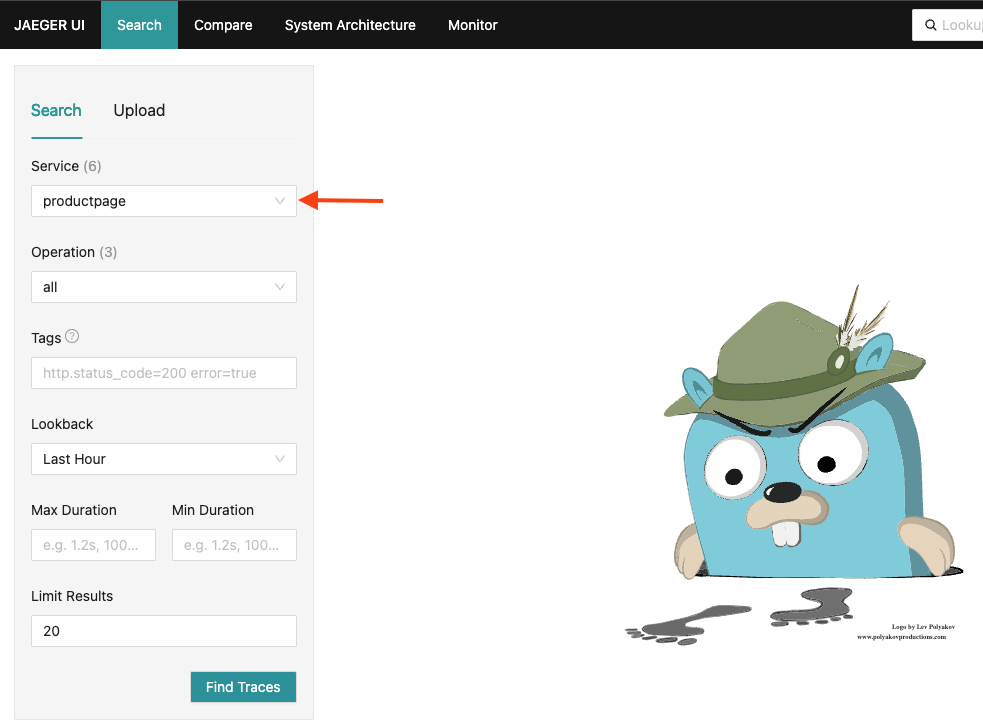
Open the Jaeger UI in your browser (e.g., https://it-fmsm-con-01-jaeger.it-cna.com)
For the Service drop-down, select the productpage service, then click Find Traces.
Note: if you do not see any traces, delete all pods in the Bookinfo namespace. This ensures the pods inherit the tracing configuration and other configuration the Consul control plane has to apply on the pods. You can use the
kubectl delete pods --all -n bookinfoto do so.
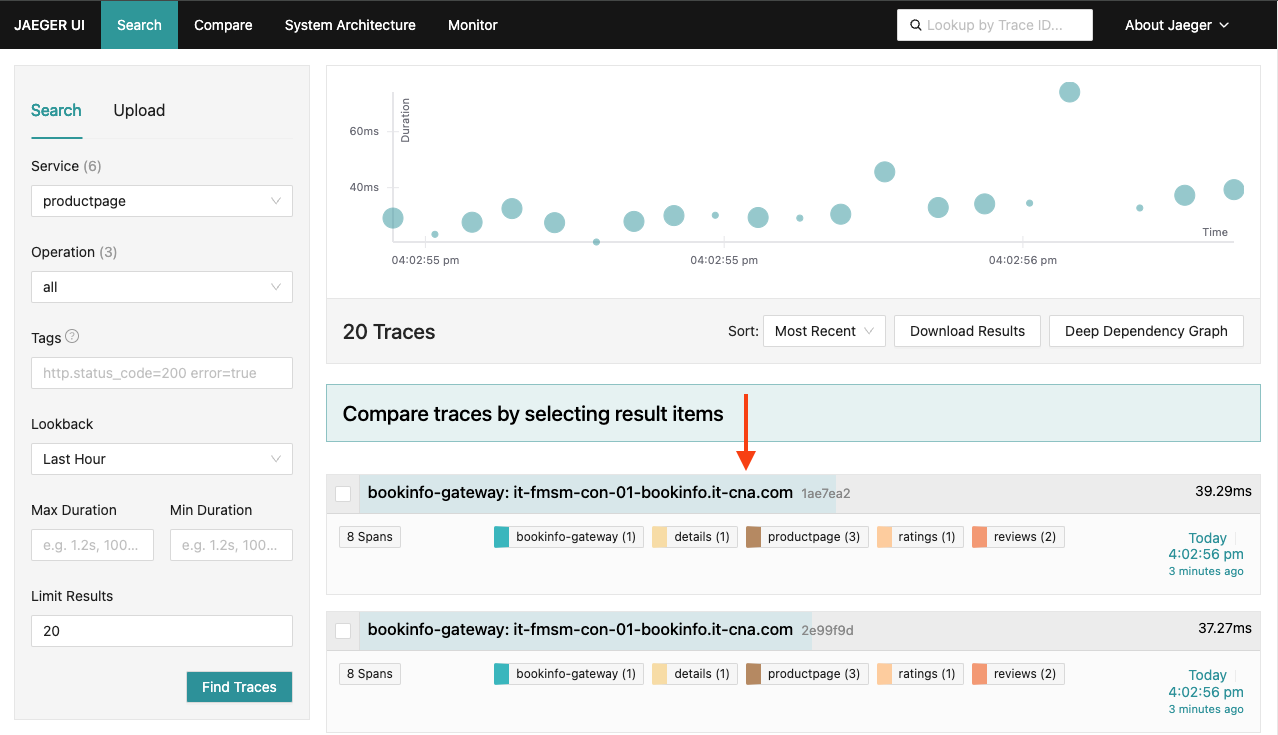
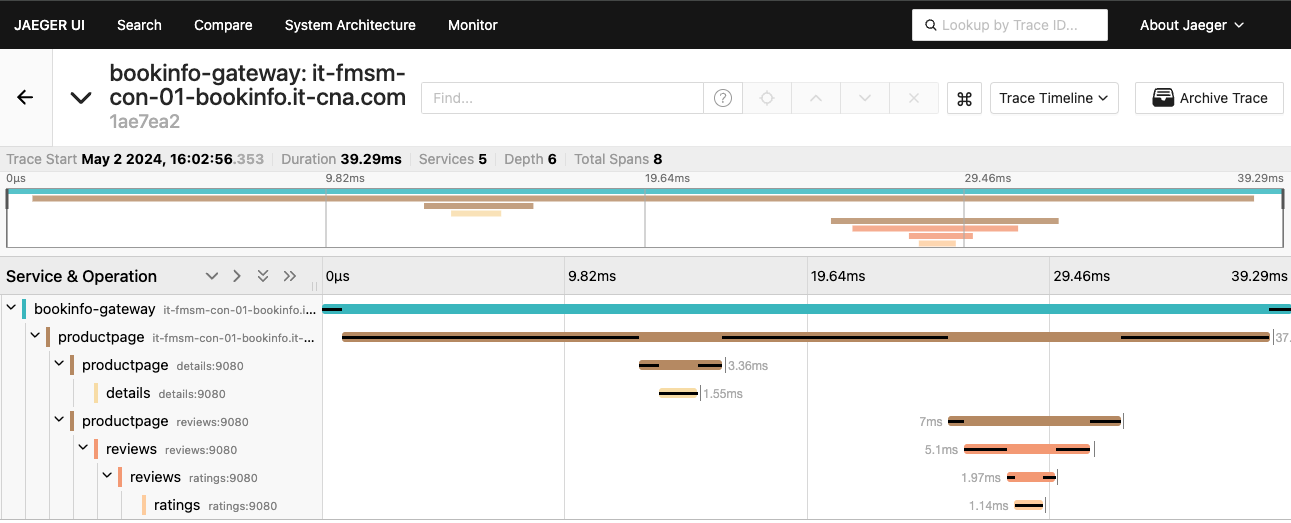
You should now see a list of traces.
The trace comprises a set of spans, where each span corresponds to a Bookinfo service, invoked during the execution of a /productpage request.
Click on the most recent trace.
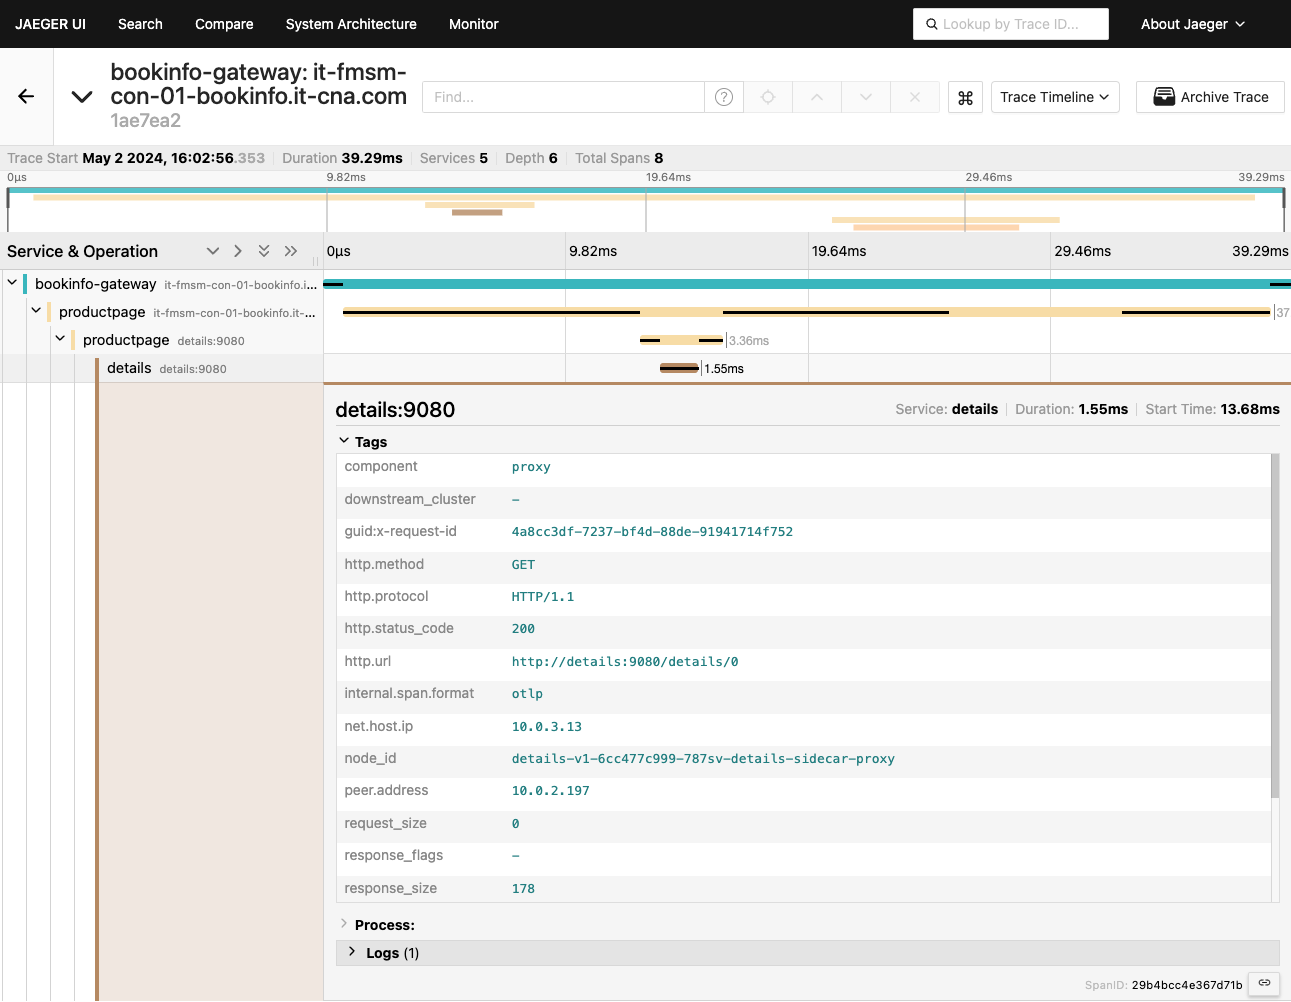
Click the details span, for example, and expand the Tags section.
You can view more information about the spans, requests, response times, etc. you can also click any of the spans for more information on the HTTP request, its status, protocol, method, URL, etc.
Important note on header propagation:
While Consul aims to be non-invasive, distributed tracing does require some application-level changes for Consul/Jaeger to combine the spans presented on Jager UI.
Although Consul proxies can automatically send spans, extra information is needed to join those spans into a single trace. Applications must propagate this information in HTTP headers so that when proxies send spans, the backend can join them together into a single trace.
To do this, each application must collect headers from each incoming request and forward the headers to all outgoing requests triggered by that incoming request. The choice of headers to forward depends on the configured trace backend. The set of headers to forward is described in each trace backend-specific task page. The following is a summary:
All applications should forward the following header:
x-request-id - this is an envoy-specific header that is used to consistently sample logs and traces.
For Jaeger, the B3 multi-header format should be forwarded:
x-b3-traceid
x-b3-spanid
x-b3-parentspanid
x-b3-sampled
x-b3-flags
The application we have been using so far contains the logic to propagate these headers.
The below is an additional example/reference for handling the header logic in a Spring Boot application:
package com.virtualpairprogrammers.staffmanagement.config;
import java.util.Enumeration;
import javax.servlet.http.HttpServletRequest;
import org.springframework.beans.factory.annotation.Autowired;
import org.springframework.stereotype.Component;
import feign.RequestInterceptor;
import feign.RequestTemplate;

@Component
public class PropagateHeadersInterceptor implements RequestInterceptor {

    private @Autowired HttpServletRequest request;

    public void apply(RequestTemplate template) {
        try
        {
            Enumeration<String> e = request.getHeaderNames();
            while (e.hasMoreElements())
            {
                String header = e.nextElement();
                if (header.startsWith("x-"))
                {
                    String value = request.getHeader(header);
                    template.header(header, value);
                }
            }
        }
        catch (IllegalStateException e) {}
    }
}
Logging and Auditing
Since we have the Envoy access logging feature enabled, we can view the access logs on all Envoy sidecar containers.
You can use the kubectl logs command to view the access logs on any of the consul-dataplane containers. The consul-dataplane container represents Envoy on each pod.
kubectl logs -l app=details -n bookinfo -c consul-dataplane
You should see many entries representing the curl requests we have been sending to the mesh.
Example output:
{"downstream_remote_address":"10.0.2.197:60068","bytes_sent":178,"response_flags":"-","duration":1,"upstream_cluster":"local_app","requested_server_name":null,"response_code":200,"request_id":"5d43e753-02d5-be63-8a58-8df9393f36ea","start_time":"2024-05-02T20:14:19.731Z","protocol":"HTTP/1.1","route_name":null,"downstream_local_address":"10.0.3.13:20000","upstream_host":"127.0.0.1:9080","connection_termination_details":null,"user_agent":"curl/8.4.0","upstream_transport_failure_reason":null,"upstream_local_address":"127.0.0.1:47436","upstream_service_time":"1","response_code_details":"via_upstream","path":"/details/0","method":"GET","x_forwarded_for":null,"authority":"details:9080","bytes_received":0}
Wrap-Up
Observability is a cornerstone of effective service mesh management. HashiCorp Consul’s integration with tools like Prometheus, Grafana, and Jaeger ensures that teams can monitor, visualize, and trace service interactions with ease.
In the next section, we will dive into Traffic Management, exploring advanced techniques like request routing, traffic shifting, and circuit breaking to optimize service reliability and performance.